Beating the Octopus? — Predicting Football Matches using Elo, Linear Regression, and CNNs
In the summer of 2010, Paul the Octopus kept a whole nation one edge after correctly predicting all matches of the German national team, as well as the final of the FIFA World Cup in South Africa. Paul communicated his predictions by choosing food from boxes decorated with each contender‘s national flag. To put this into context: the chances of predicting the correct outcome for all these matches are approximately 0.4% (in other words 1:256).

In the spirit of this incredible and (arguably) lucky achievement, I was wondering if it might be possible to replicate these seemingly supernatural abilities with modern Machine Learning (ML) methods rather than random guessing and thus disembarked on this little side-project.
Data scraping and scope
Similar to my previous project (Bundesliga Streamlit dashboard BuLiAn: Article | Repo | Dashboard), data was scraped from a popular football news portal using the Python library BeautifulSoup in combination with multiprocessing to speed up the whole process. As this time more data was required to train an actual model, the scope was extended to include data from several football leagues:
- Germany (1. & 2. Bundesliga): Season 2013/14 until 2023/24
- Spain (La Liga): Season 2018/19 until 2023/24
- Austria (1. Bundesliga): Season 2018/19 until 2023/24
- Switzerland (Super League): Season 2022/23 until 2023/24
- Brazil (Campeonato Serie A): Season 2013/14 until 2023/24
- Netherlands (Eredivisie): Season 2018/19 until 2023/24
- France (Ligue 1): Season 2018/19 until 2023/24
- England (Premier League): Season 2018/19 until 2023/24
- Italy (Seria A): Season 2018/19 until 2023/24
- Portugal (Primeira Liga): Season 2018/19 until 2023/24
- Turkey (Süper Lig): Season 2018/19 until 2023/24
- Greece (Super League): Season 2022/23 until 2023/24
Inspired by Stübinger et al. [1], there was an attempt to include player ratings from EA SPORTS FIFA in the prediction model. However, this idea was discontinued after linking the virtual players with their counterparts from the real line-ups using the Levenshtein distance [2] leading to only about half of all line-ups ending up with more than 8 correctly matched players.
In total, 12,637 matches in 13 leagues were captured with their respective statistics in several tables including:
- General match info: kick-off date, kick-off time, weekday, match day, season, referee, coaches
- Player Line-Ups & Events: players in the starting formation, cards, cumulative yellow cards, substitutions
- Team stats: home indicator, air tackles, corners, crosses, distance covered, dribblings, fouls, goals, offsides, passes, possession, shots on goal, tackles, passes, and their respective success ratio if applicable
General Data Preprocessing
Before doing any advanced data processing, each table was assigned a game_id (md5 hash over league, season, match day, and team names) to make it easier to join them later on. In addition, strings were cleaned by replacing left-over elements from the HTML pages, as well as converting them to lowercase and data type casting where necessary. The data was structured in a bronze (raw), silver (preprocessed), and gold (ingestion) layer.
Calculating Elo Scores for Teams, Coaches and Players
Intuitively, when thinking about a team’s performance winning against a team that is considered “better” should be weighted more than obliterating the underdog. After all, you would be more likely to brag to your friends about that time you nutmegged Messi, but less likely to tell them the same when your opponent that 12-year-old kid from down the street. In addition, winning with a 3-goal difference should also affect your perceived rating more than winning with fewer goals.
This is where the elo-system comes in place, which is commonly used to rate chess players but can also be applied in other sports like football [3]. In the elo-system, a team’s new rating Rn is calculated by adding its old rating Ro and the change in points P for the currently observed match:
To calculate the change in points P, the weight index K (commonly set to 20) is multiplied by the goal difference index G and the difference between the actual result (mapping 0 to a loss, 0.5 to a draw, and 1 to a win) and the expected result:
The goal difference index G itself however is not just the difference in goals. For a goal difference of 0 or 1, it is set to 1; for a goal difference of 2, it is set to 1.5; and for a difference larger than 2, it follows the following formula:
The expected result We is calculated using the following formula, where dr is the difference in elo-ratings between the teams:
For this ML model, the weight index K was set to 20, and the starting elo-score of each team, player, and coach was set to 1300 before finally calculating each of their respective elo-scores prior to each kick-off.
Predicting Playing Style with Linear Regression
As the goal of the model is to predict the outcome of a game based on data that is known prior to the kick-off, it is essential to try to predict the playing style of each team. A suitable model to predict this kind of values is linear regression [4]. Of course, your playing style will differ drastically when facing a higher rating elo-team (e.g. Liverpool), as compared to a lower elo-rating team (e.g. Fürth).
The x-axis of our linear regression model should therefore be the elo-difference and the y-axis the observed stat. As more recent events (i.e. the current trend of a team) are more significant, weights are calculated based on a time dimension using a quadratic function and assigned to each data point. Below is a schematic depiction of a linear regression model for a team’s passes, where each data point is shown in different shades of blue (depicting their weight or “freshness”) and the red line depicting the curve fit:
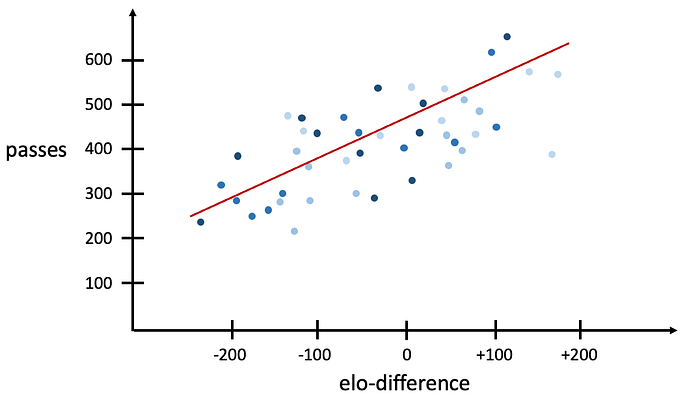
Based on this linear graph, we can now calculate the expected stats per game for each team by simply following the formula y = m*x + c, where y is the expected value, m is the coefficient of the graph, x is the elo-difference between the team and its opponent and c is the intercept of the graph.
Training and Evaluating Convolutional Neuronal Networks
Several Convolutional Neural Networks (CNNs) were trained using the TensorFlow library, each trying to predict a different target value. The neural networks were ingested with 56 features: match day, weekday, kick-off time, elo-ratings of each team, coach, average player elo-rating and respective standard deviation, average cards given by the referee, and finally the expected stats of each team based on the linear-regression model.
Matches with missing data were removed, as well as the first 5 match days of each season, as the extended break in between seasons leads to uncertainty. In total, 7,855 matches were eligible to be used for training and testing the model. Each model iterated 100 epochs and the data was split into a training dataset (70%) and a test dataset (30%). Even though several different layer combinations and unit amounts were tried, all three models showed the best performance with below similar hyperparameters.
CNN-Model 1: Predicting the outcome (win_home, draw, win_away)
The first model was trained to predict the outcome of a game, with the target being three classification labels. The first model had two intermediate layers (48 and 24 units), each with a dropout rate of 0.5.
model = tf.keras.Sequential([
            normalizer,
            tf.keras.layers.Dense(48, activation='relu'),
            tf.keras.layers.Dropout(0.5),
            tf.keras.layers.Dense(24, activation='relu'),
            tf.keras.layers.Dropout(0.5),
            tf.keras.layers.Dense(N_CLASS, activation="softmax")
        ])

model.compile(optimizer='adam',
              loss="categorical_crossentropy",
              metrics=['accuracy'])
This model was able to predict the outcome of a match with an accuracy of 48.24% when evaluated against the test dataset.
CNN-Model 2: Predicting a win of the home team
The second model was trained to predict a home win, with the target being binary classification labels. The second model also had two intermediate layers (48 and 24 units), each with a dropout rate of 0.5.
model = tf.keras.Sequential([
            normalizer,
            tf.keras.layers.Dense(48, activation='relu'),
            tf.keras.layers.Dropout(0.5),
            tf.keras.layers.Dense(24, activation='relu'),
            tf.keras.layers.Dropout(0.5),
            tf.keras.layers.Dense(N_CLASS, activation="softmax")
        ])

  model.compile(optimizer='adam',
                loss="binary_crossentropy",
                metrics=['accuracy'])
This model was able to predict the outcome of a home win with an accuracy of 62.35% when evaluated against the test dataset.
CNN-Model 3: Predicting an over/ under 10.5 of corners
The last model was trained to predict whether there will be more or less than 10.5 corners in a match, which is a popular prediction in sports betting with binary classification labels. The second model also had two intermediate layers (48 and 24 units), each with a dropout rate of 0.5.
model = tf.keras.Sequential([
            normalizer,
            tf.keras.layers.Dense(48, activation='relu'),
            tf.keras.layers.Dropout(0.5),
            tf.keras.layers.Dense(24, activation='relu'),
            tf.keras.layers.Dropout(0.5),
            tf.keras.layers.Dense(N_CLASS, activation="softmax")
        ])

  model.compile(optimizer='adam',
                loss="binary_crossentropy",
                metrics=['accuracy'])
This model was able to predict the outcome of over or under 10.5 corners in a match with an accuracy of 58.89% when evaluated against the test dataset.
Conclusion
While certainly not as good as Paul the Octopus, the three different CNNs in combination with the elo-rating and linear regressions were able to predict different target outcomes of football matches to some extent. An interesting use case to follow up would be to evaluate how these CNNs fare against betting quotas from bookmakers and whether arbitrage is possible through this advantage.
Maybe there will be some simulation done on my blog in the future, so stay tuned and subscribe for updates!
Links
Github Repository: tdenzl/krake-paul (github.com)
Sources
[1] Stübinger, Johannes & Mangold, Benedikt & Knoll, Julian. (2019). Machine Learning in Football Betting: Prediction of Match Results Based on Player Characteristics. Applied Sciences. 10. 46. 10.3390/app10010046. (PDF) Machine Learning in Football Betting: Prediction of Match Results Based on Player Characteristics (researchgate.net)
[2] Levenshtein distance — Wikipedia